

Using the basics of Python Pandas to conduct an analysis on SAT and ACT data of 2017-2018 and providing a solution to the College Board.
The SAT is a standardized test widely used for college admissions in the United States. Since it was debuted by the College Board in 1926, its name and scoring have changed several times; originally called the Scholastic Aptitude Test, it was later called the Scholastic Assessment Test, then the SAT I: Reasoning Test, then the SAT Reasoning Test, then simply the SAT
The ACT originally an abbreviation of (American College Testing) is a standardized test used for college admissions in the United States. It is currently administered by ACT, a nonprofit organization of the same name. The ACT test covers four academic skill areas: English, mathematics, reading, and science reasoning. It also offers an optional direct writing test. It is accepted by all four-year colleges and universities in the United States as well as more than 225 universities outside of the U.S.
From the dataset
SAT_2017.csv
SAT_2017.csv
ACT_2017.csv
ACT_2017.csv
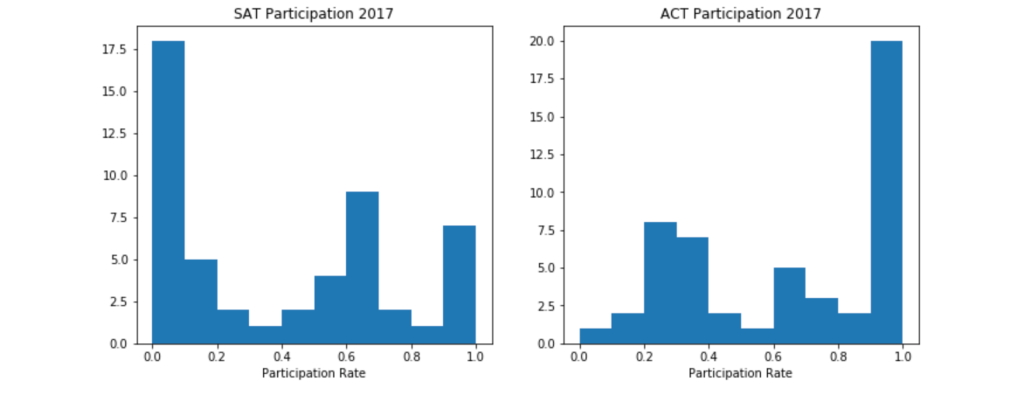
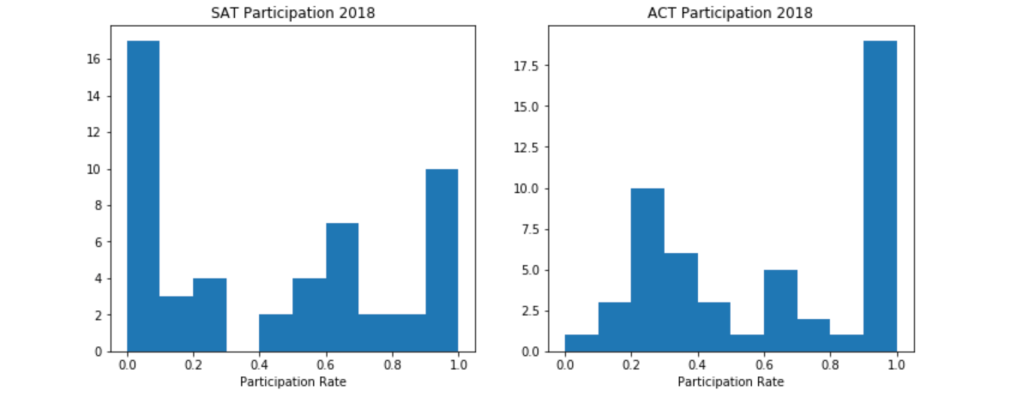
Below distribution plots showing that the distributions for SAT participation rate and ACT participation rate have not changed dramatically from 2017 to 2018.
- Mean scores on a given test are highly negatively correlated with participation rate on that test (-0.8). Lower participation typically means higher mean scores, and vice versa, due to higher achieving students on average taking the test.
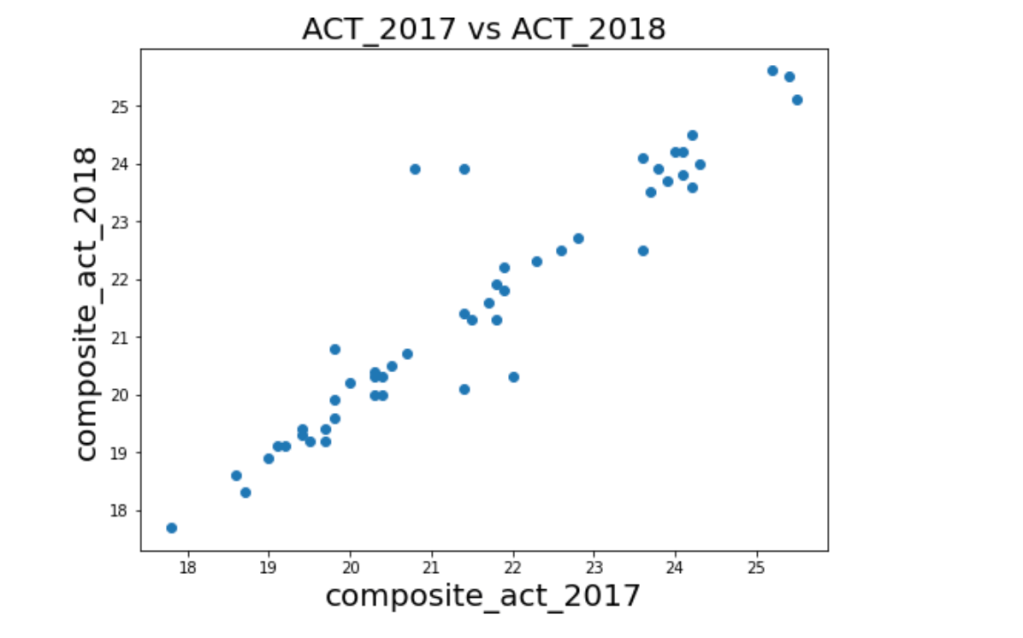
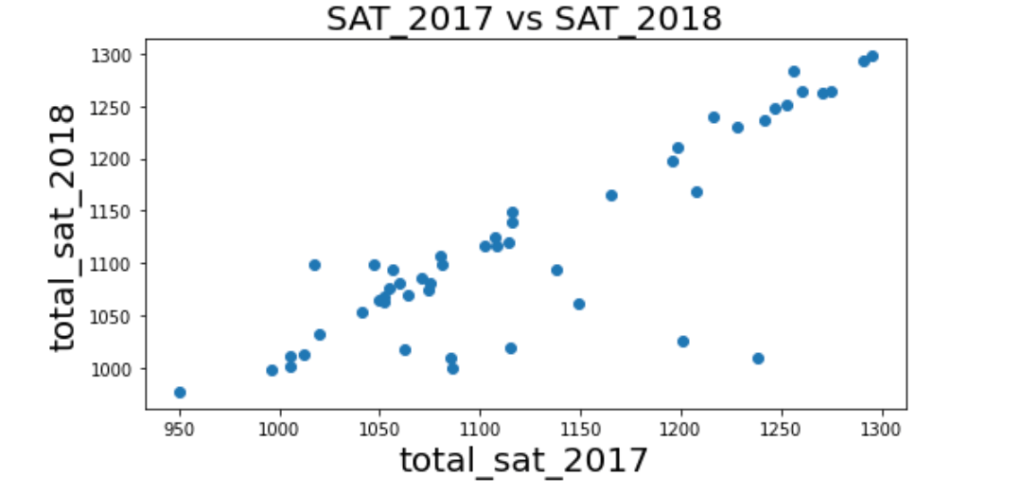
- If a state performs well on the SAT because they have low participation or simply because they are higher achieving, it’s likely they perform well on all sections. This holds across years too, as most states have similar profiles in 2018 as they did in 2017. Participation rates for the same test across years are highly correlated.
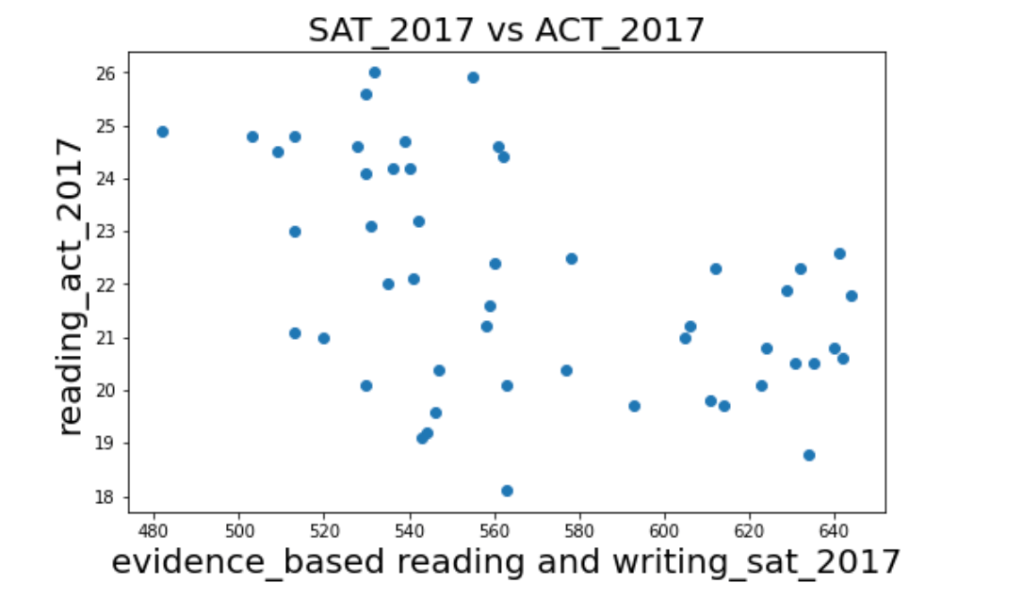
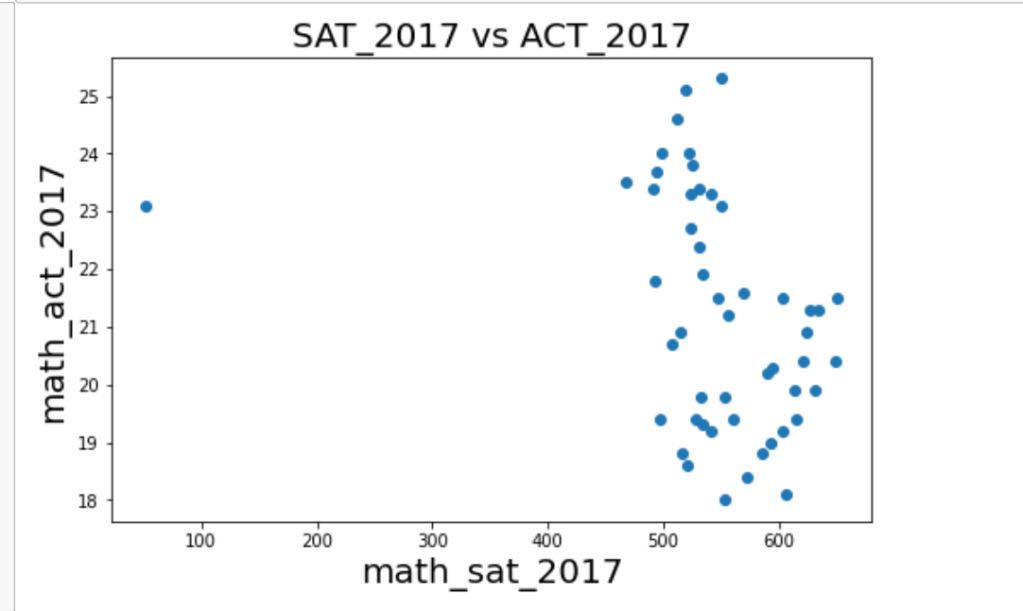
- Mean scores on sections of the SAT are moderately negatively correlated with mean scores on ACT, and vice versa.
- Participation rate on a given test is moderately positively correlated with scores on the opposite test (0.6). Again, this is simply due to higher participation on SAT > lower participation on ACT > higher ACT scores. So, positive correlation between SAT participation and ACT scores.
There are three things that we can describe, the distributions: the shape of the distribution, the spread of the distribution and the central tendency of the distribution.
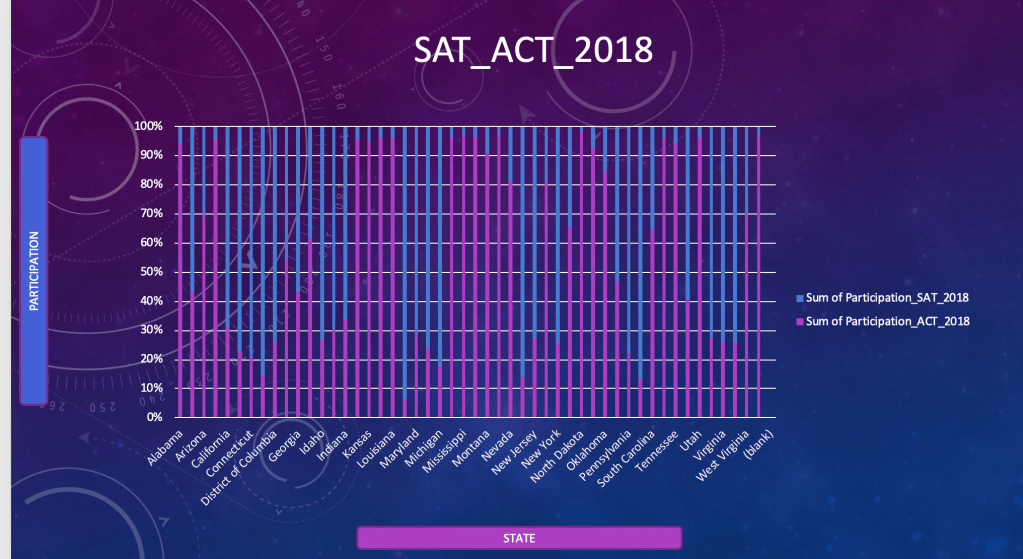
After more research, I was able to find out that some states had high participation rates in SAT, they had low participation in ACT. And states that had high participation rates in ACT, had low participation in SAT.
Below you can see the participants plots .
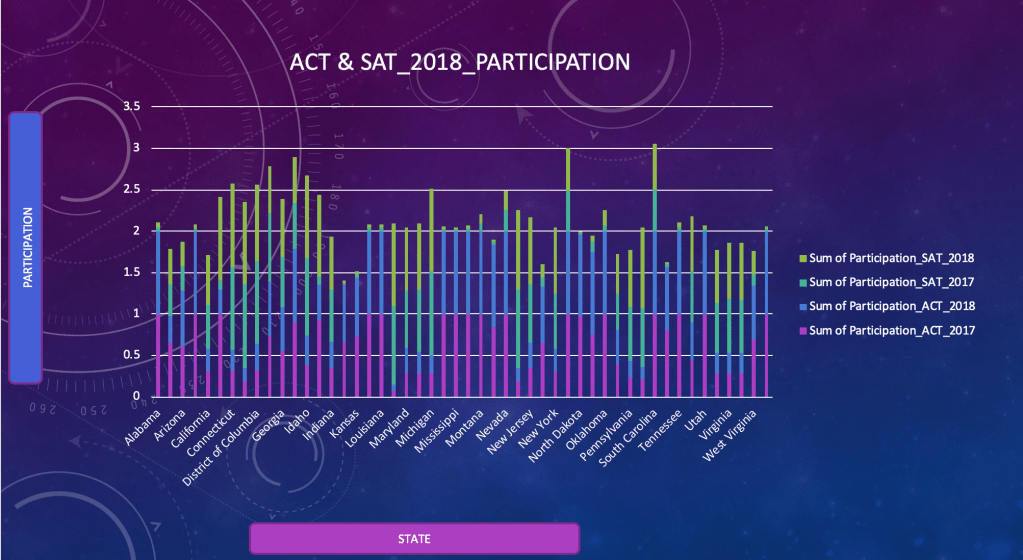
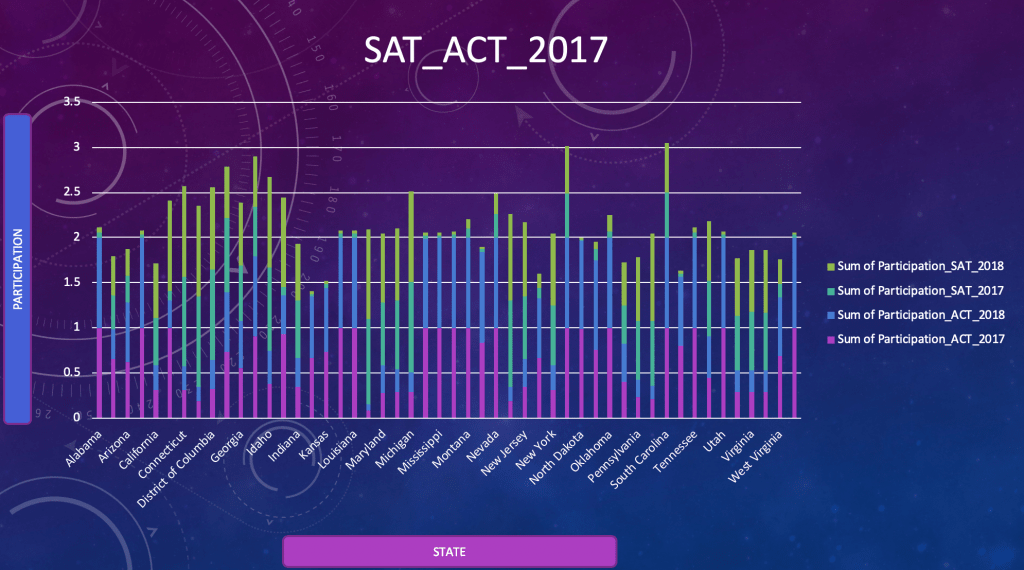
Another way say higher SAT scores negatively correlated to its participation rate. The same with ACT scores. Generally, students would rather just stick with one.
Above scatterplots clearly demonstrate the relationship between participation rate and test scoring. For both tests, lower rates of participation correspond with higher mean score by state. In the SAT plot, for instance, you can see the cluster of ACT-dominated states at top left where SAT participation is very low and mean scores are all >1200. The small subset of high achieving students that bother to take both tests are high scorers, and so these states have artificially higher score averages. The downward slope of both graphs indicates the negative association between the variables.
OBSERVATION
From the below graph, following are the observations-
- Colorado and Illinois show drastic participation change in both the exams.
- Participation rate is vice versa in both the exams, they are not accepting both the exams
- Participation of the states are not normally distributed in both the exam
- High participation have low result score (especially for English, math and reading).
- Fewer participants have higher scores
Recommendations
I found statistical inference will give more or less sense to conduct this because some prospects we can cover through statistical inference. Even though it is not enough to find out the proper analysis in all prospects to cover up.
Required more specific data. For example, to get a zone wise classification of states can be considered for specific evaluations. Government should enhance campaign or strategy on this so that states get more participants.
Finally, if they really can’t enhance the participation rates in the states, SAT has a very strong presence internationally and so College Board can use this as a strength and dominate more in that aspect. All in all, the data is great for distinguishing how well the tests themselves are doing but doesn’t provide useful information to help improve SAT participation. There are many other factors we need to consider to make a better suggestion.
And we can say, why don’t we make an uni entrance exam and let every student take it? This will leave more time for student to enjoy their high school and save money and resources for setting up multiple exams.
