
Overview
Predicting Ames House price by conducting some exploratory data analysis followed by processing the data based on the findings. This was an individual set up project to participate in Kaggle competition to build the best regression model to predict housing prices based on the test CSV. file provided to us.
For the data processing to start I was supplied two data sets one is training data sets (csv. file) containing all the information of Ames House Project, that data used to make a model which aimed at predicting the housing prices of the other csv. file labeled test.csv. The test.csv file has all the columns of the train.csv except it is missing the prices of each houses. Data sets contain total 2051 observations with 82 variables.
I imported all the required libraries panda, seaborn, matplotlib, pyplot, sklearn. I cleaned the datasets for further analysis. Next I split the train datasets into two separate datasets so I could build a model on one part of the data and test its performance on the other sets. This will be allowed me to predict how my model would perform on unseen data. My model was scored against the true sale price using Root Mean Squared Error and placed Twenty Fifth out of all General assembly fellows nationwide and Second position in localwide.
Reading data
I read the train data set first converted this into a Data Frame to analyze.
Exploratory Data Analysis
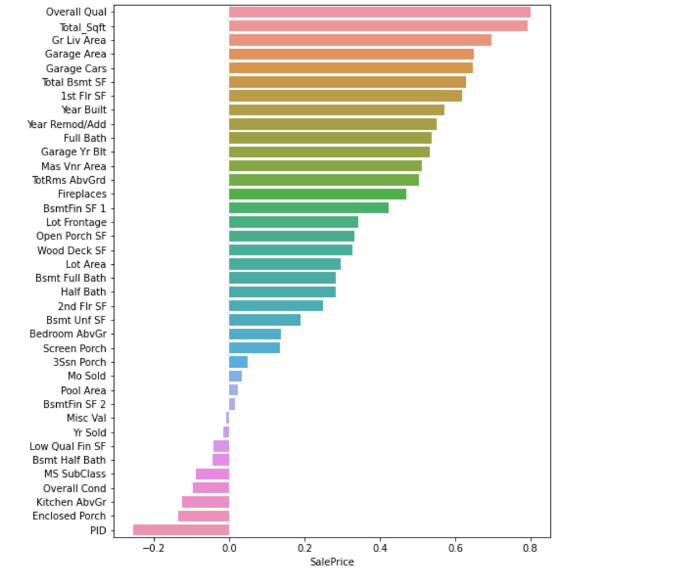
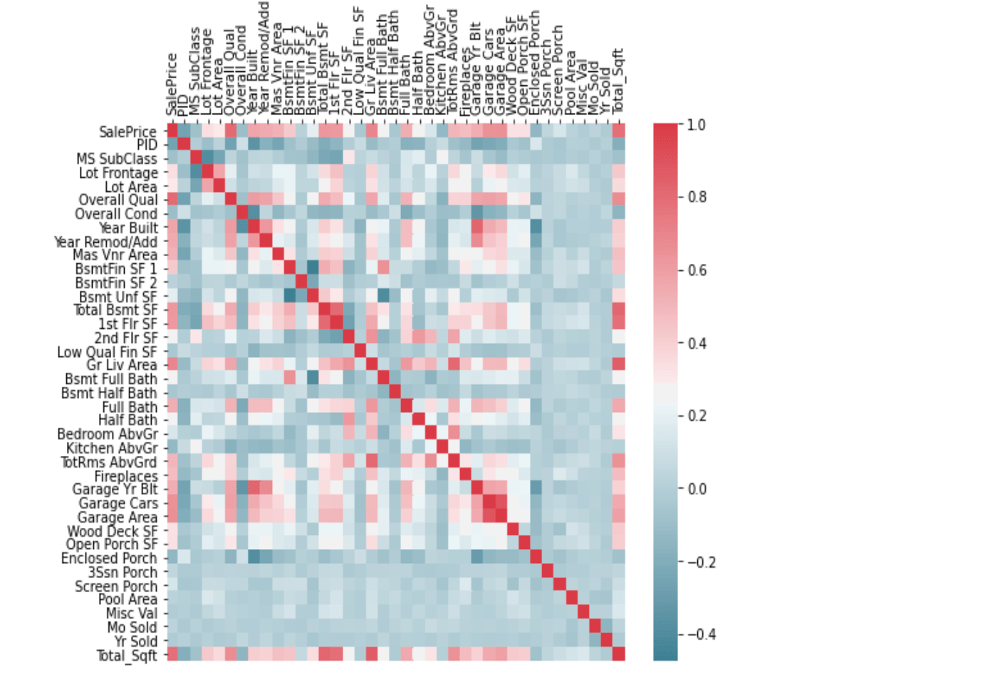
Then I started to do analysis on all features by correlation matrix to see the correlation amongst the features as well as the target price and then I created a heatmap to visualize it. Then I created distribution graph to see the distribution of all the features. Then I started looking for features which could be used in my predictive model. Features that are strongly (positively and negatively) correlated with price will probably be good indicators/predictors of price. Features that have strong correlations amongst themselves have collinearity, from these features I will want to pick the strongest feature and exclude the others since a principle assumption of linear regression models is the independence of features.

Cleaning
Null values are values which are missing. After checking the amount of null values which are in the features, I decided to drop these.
Feature Engineering
I tried some feature engineering on some interesting features and tried to find out there any impact on sale price. I found on neighborhood, year sold, Ground living area, year sold of the houses shows some interesting linearity on sale price. I created some plots on these.
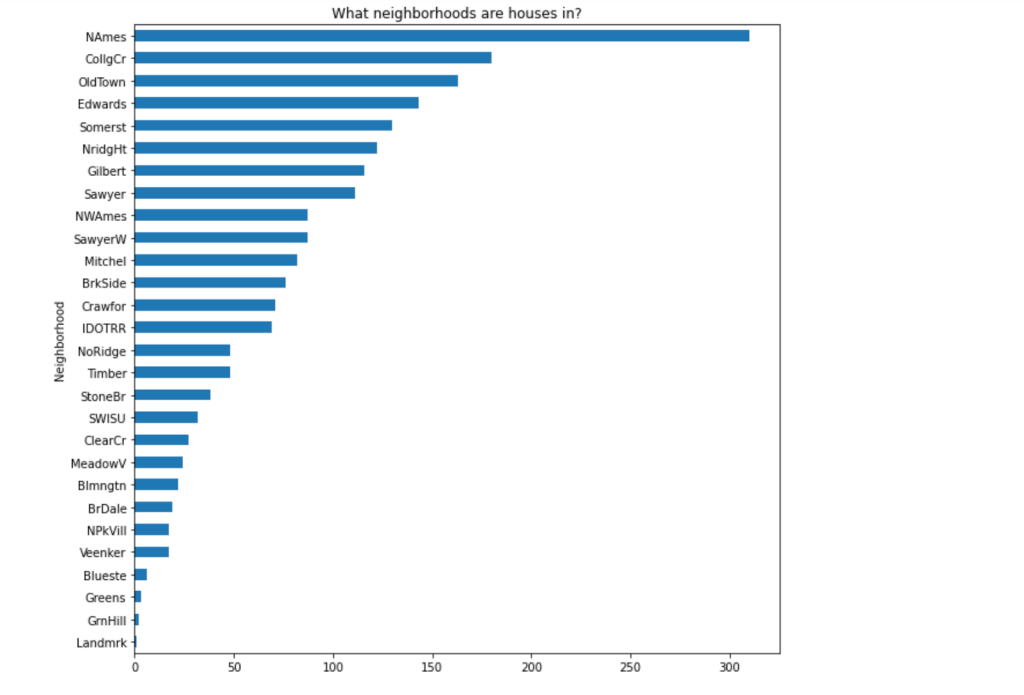
From the plots it shows that It would also be interesting to augment the dataset with additional information as it relates to neighborhoods.
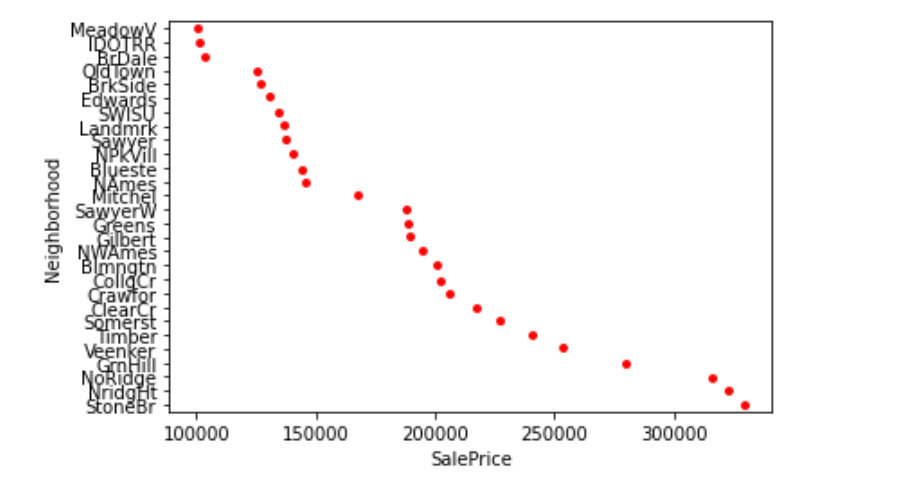
(For an example)
#Neighborhood 1: MeadowV:BrDale
#Neighborhood 2: BrkSide:Mitchel
#Neighborhood 3: SawyerW:Veenker
#Neighborhood 4: Timber:NoRidge
Interestingly, I see four clusters of neighborhoods above. we can categorize them and can approach which neighborhoods showing more expensive. It Looks like a good chunk of houses are in North Ames, Collect Creek, and Old Town, with few houses in Bluestem, Northpark Villa and Veenker.
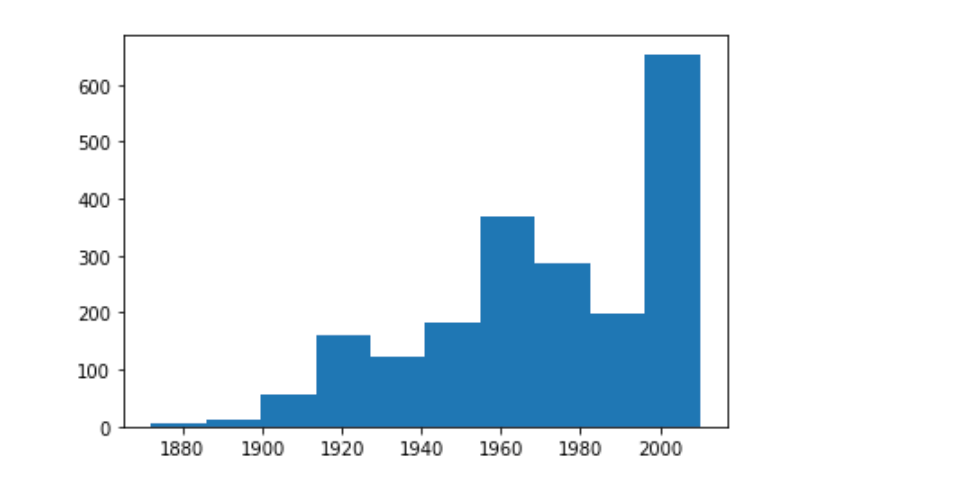
Based on the above, I would identify the following construction periods.
Oldest house built in 1872. Newest house built in 2010. Not much action in the 80s apparently. Looks like majority of houses were built in the 50s and after, 1985-2010: Extended growth leading up to the Great Recession.
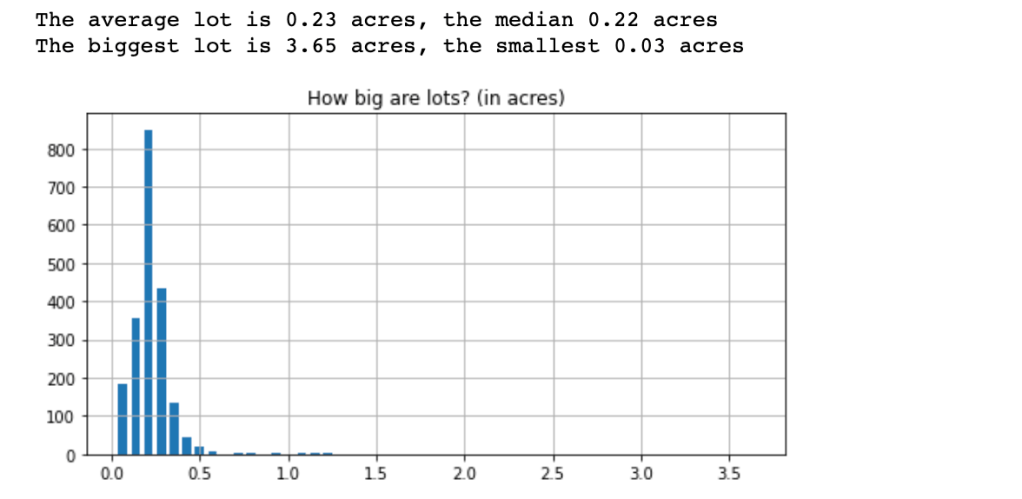
Also found some interesting area covers means how big houses are made in a lot area, but there are also found some outlier .(You can see in the plot)
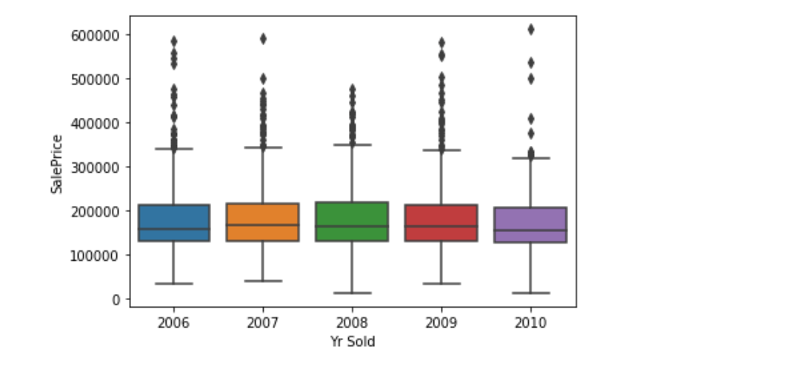
From the above plot it shows that Ames seems to have been immune at the Recession time.
There for may be ,Given the city’s being ranked by Bloomberg in the top 15 “cities that have done best since the recession”.(Wikipedia shows)
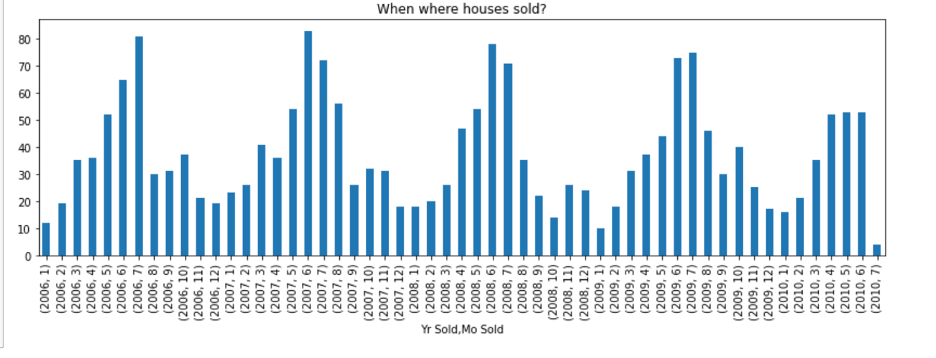
Then I found some interesting on month and year sold which shows the seasonality pattern reflection.
Model building
After doing all of this, I built a linear regression model on my selected features and then used this model on the test split of the data and got an RMSE score, as well as R-squared score for the test data.
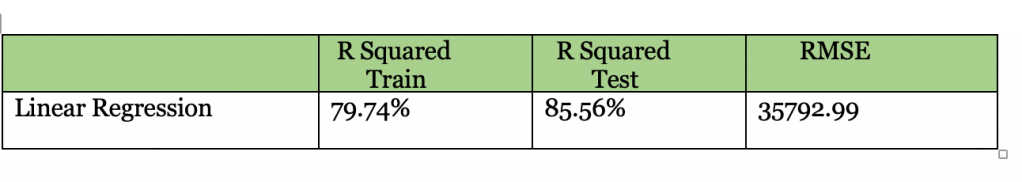
My linear regression model did well. The RMSE was 35792.99 which stands for the calculated difference between each predicted price and the actual price of all the homes.
It had a 0.8586 R-Squared score on the test and a R-Squared score of 0.7974 for the training data. This shows the model is doing a great job of predicting both the training set and the testing set since there is such a drop in the R-Squared score on the testing set. Overall, the model is accounting for 85.86% of the variance in the price
The feature with the highest correlation to sale price was my engineered feature for total square footage. Other important features were the overall quality of the home, Year Re modification or adding (another feature I engineered), Basement uniform Square feet and lot area.
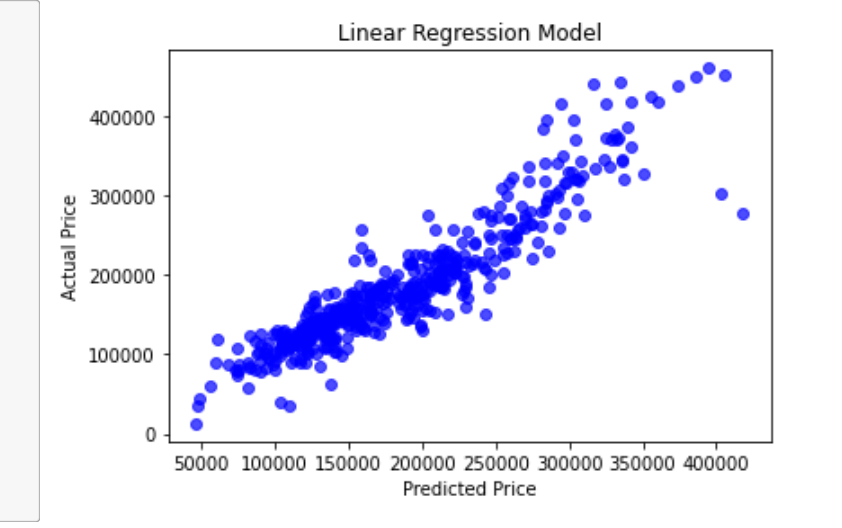
This is a scatter plot of linearity between actual price against predicted price.
Conclusion
At the end, my initial strategy for feature engineering and selection was good since it performed well. With a RMSE of 35792.99 I am confident that my model can perform adequately when predicting house prices in Ames, Iowa provided enough information about the house features.
If I had more time, I would have spent more time cleaning the data or impute some data and dealing with outliers. I will go for more regularized model Lasso or ridge to get more accurate prediction. I would have also possibly looked into creating some interactions. Another feature I could have created was an Age feature which stated the age in years of each home.
By applying my own intuition to my feature selection, I was able to make a model which predicted the prices of the competition data with an RMSE of 35792.99
This submission placed 25th out of all General Assembly fellows nationwide and placed 2nd position out of all General Assembly fellows local wide.
For more details, please visit my GitHub.
